What Is Experimentation – Data Science Consulting

Photo by Nicolas Thomas on Unsplash
In general, a scientific experiment is any process in which measurements and tests are used within a (typically) controlled environment to support or refute a hypothesis. Experiments can also be used to “evaluate the efficacy or likelihood of something previously untried” (Chugh 2022). Hypotheses are unsupported propositions, usually based on insights or prior research, from which an investigation can be developed.
Before an experiment is executed, data scientists must answer a few questions. What is the best way to support (or disprove) our hypotheses? What are we measuring and how? What data do we need, and where can we collect it? What tools and libraries should we use? These problems, among many others, must be solved before initiating the experiment. Without proper planning, many issues may arise throughout the workflow. The efficiency of the experiment can be compromised, and the intended questions may not be properly answered. The process of organizing an experiment and answering the key initial questions is termed experimental design.
An experimental design also often includes creating an experimental workflow. First, a hypothesis or question must be formulated. The underlying hypothesis data scientist attempts to answer helps guide the processes necessary to then design the experiment. Designing an experiment involves determining the best way to gather the data and test the hypothesis. Data scientists then attempt to identify any problems or sources of error that may occur during the experiment. It is only after completing these three steps that data is actually collected. In summary:
- Formulate a hypothesis
- Design an experiment
- Identify problems and sources of error
- Collect data
Variables in experimentation
All scientific experimental design (including data science) involves a set of variables on which the experiment is focused. The independent variable (x-axis) is not dependent on the movement of other variables. Independent variables are also typically manipulated to measure their effects on the dependent variable(s). Dependent variables (y-axis) are expected to change because of changes in the independent variable(s). We can also understand hypotheses as educated guesses on the relationship between independent and dependent variables. There can be multiple independent and dependent variables in an experimental design but including more than one of either will require additional hypotheses. Prior to collecting data to test a hypothesis, data scientists must consider any factors that can cause errors in the results. Confounding variables (or confounders) are one set of factors that may cause these errors in results because they can make the relationships between dependent and independent variables unclear.
Confounding variables and how they are managed
It is important to design experiments in a way that considers and controls confounding variables before they affect results. Without proper management of confounding variables, data scientists could make incorrect conclusions based on variables that are outside of the scope of their experiment. If the purpose of the data science experiment is to support a crucial field like medicine, defense, or finance, incorrect conclusions could have dire effects. There are fortunately a few ways to make sure confounding variables do not ruin the efficacy of your experiment:
- Controlling for variables
- Randomizing subjects or data
- Replicating the experiment
Controlling for confounding variables involves splitting participants (or data) into two groups – a control group and a treatment (or experimental) group. Control groups are not altered or are tested with a placebo (common in clinical trials). Treatment groups are then manipulated with the experimental strategy (e.g., given a pharmaceutical drug). This allows researchers to isolate and study the effects of their experiment on the treatment group while analyzing the baseline control group.
Randomizing individuals into control and testing groups reduces the risk of biasing one group towards a confounding variable (like age, education, or race if these are not what you are investigating). Data scientists may not initially know all the confounding variables within their given experiment, and thus randomization allows for a more generalized sample group. If you deliberately split participants into confounded groups (separated by factors outside of that particular study like age or race) and randomized groups, each with their own control and treatment groups, you may be able to tell what the confounding variables are when comparing data with the randomized group.
Replicating an experiment with different subjects provides peer reviewers and public audiences more assurance in your results. Achieving experimental results once could be due to chance, confounding variables, outliers, or systematic errors in data collection. Achieving the same results multiple times (with new sets of subjects or data) is a sign that the experiment is well designed and that the results are relatively generalizable. The P-value is a statistical tool meant to measure the likelihood that an observed outcome is due to chance (Beers 2022). P-values can also be thought of as a measurement to validate a hypothesis against observed data. Many researchers strive to achieve the lowest P-value possible (or at least P ≤ 0.05) and replicating the results of an experiment can help in this pursuit. You can find the P-value by calculating the Z statistic, a measurement of how many standard deviations above or below the mean population the score derived from a z-test is, and then comparing that z statistic to a p-value chart (Chen 2022):
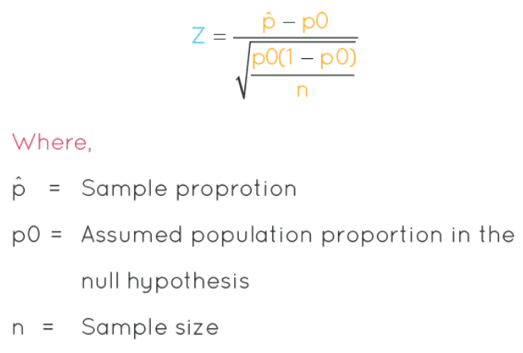
(Cuemath.com)
A/B testing: Netflix case study
One data science experimental strategy many companies use is A/B testing. At Netflix, A/B testing is commonly executed to measure the outcomes of different UIs or media recommendation strategies. Rolling out a software innovation to a whole audience of subscribers is often too risky to do without experimentation. A/B testing is a simple experiment with a control group and one or more treatment groups. Netflix first samples a random subset of its members and then randomly assigns the sample members into control and treatment groups. The control group continues to receive the unchanged UI experience, while the treatment groups receive different UIs based on a particular hypothesis about improving the member experience (Martin Tingley, Netflix Technology Blog, 2021).
It is also important to note that each member is only assigned to one treatment group within a given experiment at Netflix. This is done to ensure that any changes in user satisfaction are not confounded by the intermingling of two tested hypotheses. Many Netflix members will become part of several A/B tests at a given time, but these concurrent tests do not modify the same feature and are thus part of a different A/B test experiment and hypothesis. To make sure concurrent tests are not conflicting, Netflix testers refer to a schedule that lets them filter tests across different dimensions to find or exclude other tests which may impact a similar area (Netflix 2016).
There are many variations on how to execute an A/B test. Data scientists must determine whether to use tests with real-time allocations that allocate subjects to groups based on evaluations from user interactions with the UI, or batch allocations that statically allocate a subset of members. In addition, many companies have their own tools, platforms, workflows, and APIs on which to carry out their experimentation. Here is the flowchart visual for the Netflix experimentation platform:
The Experimentation Platform (Netflix)

(Netflix 2016)
Multi-arm bandit
One major drawback of A/B testing is that a large portion of your website traffic may be routed to a version of your UI that does not maximize conversions or sales. In A/B testing, you may show some random visitors to your site a newly formatted homepage to discover if the new format is optimal. If it is not better than the original iteration, you may lose business.
Multi-armed bandit (MAB) is a form of A/B testing that uses machine learning to push visitor allocation towards better-performing iterations of your site. The algorithm learns from the business analytics metrics and reduces the traffic allocated to underperforming iterations. This is the crux of MAB, it’s a “dynamic traffic allocation algorithm”, and it is a powerful statistical method used to continually route visitors to the iterations with the highest sales and conversion rates.
Unlike a classic A/B test, MAB attempts to conserve business performance throughout the test. The basis of the MAB is a thought experiment where a gambler must choose among multiple slot machines with different payouts (some good some bad). The goal is to pull the slots one at a time and maximize the take-home value, even when the gambler is unaware of what is behind any of the slots. You may begin to see how this relates closely to the challenge many companies face when choosing the most optimal iteration of their software from an array of options.
Use cases of MAB vs A/B testing
MAB may seem like an overall better option than classic A/B testing, but in reality, they have different use cases. A/B testing is preferred for cases where the experimental purpose is to collect data from all tested iterations and arrive at the most statistically significant winner. A/B testing can also optimize for multiple metrics, while MAB typically optimizes for one key metric at a time. Overall, classic A/B testing gives businesses more data to support their decision-making. It also means that the wide array of (positive and negative) sales and performance data can be analyzed, post-experiment, and incorporated into a later project.
MAB is preferred for cases when the interpretation of an iteration’s results and performance is not necessary. Remember that the primary concern of MAB is maximizing conversions and minimizing the loss of sales from testing. MAB is also preferred when there is a time constraint on gathering statistically significant results and choosing which iteration is optimal. MAB beats A/B at decision-making speed in the context of optimizing business performance because of machine learning and dynamic allocation. This is especially crucial for low-traffic sites where classic A/B tests would take a very long time to get enough data for statistically significant results. When the opportunity cost of lost conversions is too high, companies prefer to use MAB to keep up conversions. If you are selling high-value products like houses or cars, the loss of even a few sales due to a suboptimal iteration could cost hundreds of thousands of dollars. This is precisely why many businesses believe MAB’s continuous optimization is more attractive than the broader set of data typically provided by classic A/B testing.
Bayesian statistics vs Frequentist statistics
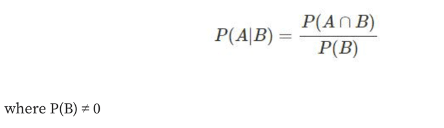
There is a thin line separating Bayesian statistics and frequentist (classical) statistics. The Bayesian approach measures probability by belief in the likelihood of a particular outcome. Evaluating the likelihood of a particular outcome with the Bayesian approach involves incorporating prior probabilities about an event which are updated with newly collected data. According to the Bayesian approach, we could assign a probability to an event like Donald Trump losing the 2020 U.S presidential race. Mathematically, Bayes’ Theorem uses the principle of conditional probability to evaluate the likelihood of event A, given that another event B has already transpired. The conditional probability of this scenario is expressed:
Bayes’ Theorem takes conditional probability further:
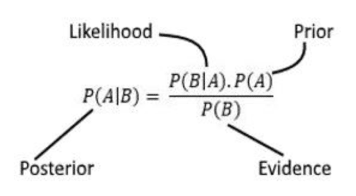
‘Prior’ refers to the probability of event A occurring based on our preconceived beliefs. ‘Likelihood’ is the probability of event B being true given event A is true. ‘Posterior’ is the probability of A to occur given B has already transpired. The ‘posterior’ term also refers to the updated ‘prior’ based on new observed evidence (Sunil 2020)
Frequentist (classical) statistics posits that the probability of an event occurring is best evaluated by analyzing the frequency at which that particular event occurs through repeated controlled experiments. Contrary to the Bayesian approach, the probabilities of events are not evaluated based on preconceived beliefs under the frequentist approach. Frequentist probabilities can only be applied to phenomena that can be repeatedly observed and analyzed.
When you toss a coin to determine whether the probability of getting heads or tails is evenly 50/50 using the frequentist approach, you may collect a table of data like this:
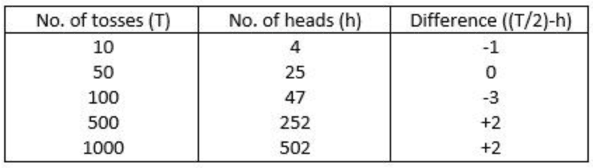
Completing more trials under the frequentist approach delivers a higher validity of data. In theory, frequentist experiments should have infinite trials, but in practice, science is limited to a finite number of trials. As such, predicting the probability of Donald trump losing the 2020 election would not fit the philosophy of the frequentist approach because it is not a scenario that can be controlled and repeated with experimentation.
The frequentist approach is more commonly used by classic A/B testing software. We start with the hypothesis that there is no difference between the two iterations. After a set of trials, we arrive at a P-value — the probability that there is truly no difference between the two iterations (typically based on sales and conversion data). With the formula p = 1 – P-value, we can express the probability that there is a difference in the iterations. The drawback is that the P-value can only be evaluated at the end of a test and not before. You may also never know the actual margin of success a winning iteration has over another — only that it outperformed the others.
The Bayesian approach is more aligned with MAB because it allows you (or the software) to learn from real-time analytics and allocate traffic to the highest-performing iteration. Bayesian statistics can also express the marginal gain of a winning test and eliminates the implementation of false positives. One drawback to Bayesian algorithms is that they require a CPU-intensive sampling loop, which could be a challenge for large companies with a lot of customer traffic.
Experimentation tools and solution services

Google Optimize (or 360) encompasses features such as A/B testing, native Google analytics integration, URL targeting, Geo-targeting, and more. Google Optimize has a free base version and a paid premium version known as Google Optimize 360. With 360, clients can run more than 100 concurrent experiments, make more than 100 concurrent personalizations, and test up to 36 combinations while running a multivariate test.

Optimizely was launched in 2010 and includes a comprehensive set of conversion rate optimization tools (CRO) to collect data about your website and its visitors. Optimizely is focused on serving very large enterprise clients only. Primarily, Optimizely offers web experimentation and personalization services, but you can also run experiments on mobile and messaging platforms.

VWO was launched in 2010 and offers a code editor, server-side testing, mobile app testing, multi-arm bandit testing, and many other tools for complex use cases. The VWO A/B testing and experimentation suite is also cloud-based, allowing you to run multiple tests on your target audience. VWO also has a powerful visual editor to map the performance of tests via the dashboard. VWO SmartStats is a feature using Bayesian statistics to run tests faster and allow clients to arrive at accurate conclusions sooner (Khandelwal, VWO blog 2022).

If you are interested in reading more about data science or data engineering, then read/watch the articles/videos below.
How to Choose the Right ELT Tool
How To Build a Data-Based Business Strategy in 2022
Onboarding For Data Teams – How to set-up a streamlined onboarding experience